High-Tech Conservation
Digital tools save water, soil and more
For producers who want higher yields, there’s an app for that—or a hundred. Yet when farmers want to deploy high-tech conservation practices on their operations, the options are thinner.
Still, several digital resources are at your disposal. One is Agren’s SoilCalculator, which estimates erosion and economic effects.
It combines color-coded aerial maps of erosion, conservation practices and crop rotations. That lets farmers look at predictive erosion maps so they can see what different management practices do.
“Growers can easily evaluate alternatives side by side to maximize profits, conserve soil, preserve yields and reduce nutrient inputs,” says Agren CEO Tom Buman.
High-tech conservation tools will be useful as demand for better water quality and greater environmental stewardship increases, says Mark Stutsman, chief operating officer of Eldon C. Stutsman, a supplier of agricultural products for retail and wholesale markets in Hills, Iowa.
“It is another layer of value we can add to the grower,” Stutsman says. “It shows our community, our friends and our neighbors that we are paying attention and doing the very best we can.”
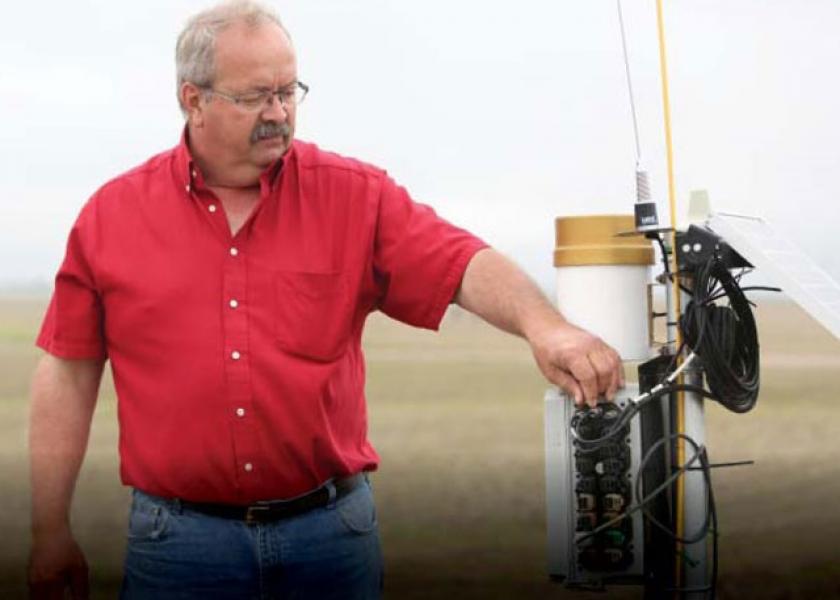
Nebraska producer Roric Paulman likes tuning into weather apps, which help him make certain on-the-go decisions a bit easier. Yet for irrigation timing decisions, that’s not enough. So Paulman, a 2015 Top Producer of the Year finalist who farms in Sutherland, turned to evapotranspiration sensors placed directly in his fields.
“We each have a responsibility to these resources, whether it’s water or soil or air,” Paulman points out. “If you start now, there are some behavior-changing opportunities that can help you both environmentally and financially.”
 Power Hour Noon Logo © |
Conservation Practices Vary By Crop Type
Implementation of conservation practices varies from farm to farm based in part on the crops producers grow, according to a 2015 report from USDA’s Economic Research Service. A total of 44% of farmers use no-till or strip-till on a total of 39% of all U.S. corn, soybean, wheat and cotton acres, USDA notes. Yet broken out by individual crop, some significant differences appear in no-till and strip-till application:
|
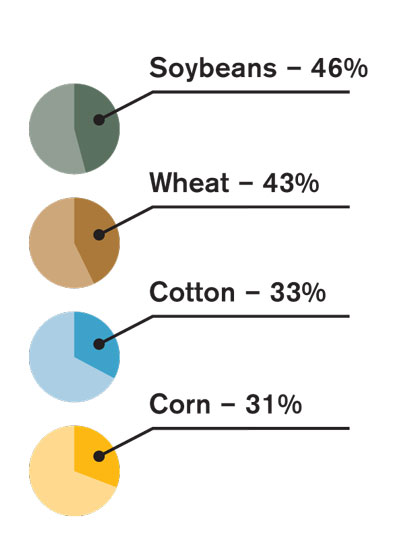
Split application of nitrogen, intended to give crops nutrients right after planting for maximum uptake, varies quite a bit by crop, too. Corn farmers apply just 22% of nitrogen after planting, for example, whereas cotton producers apply 59% of nitrogen after planting.
To view USDA’s full report, visit http://1.usa.gov/1KaeojN.