Farm Debt-to-Income Ratio Points to Continued Farmland Price Strength
$13,400 per acre in Cedar County, Neb. $17,000 per acre in Douglas County, Ill. $26,000 per acre in Johnson County, Iowa.
This has delivered numerous mind-blowing farmland sales. But will this runup in values continue?
The odds are likely, according to a key ratio that compares farm debt to farm incomes, says Mike Walsten, contributing editor to LandOwner.
“The farm debt-to-income ratio suggests the land market is not so heavily leveraged that a downturn in profits will bring a rush of forced land sales that would crush land values in the short term,” he says. “I expect the land market will continue to see strong demand well into next year.”
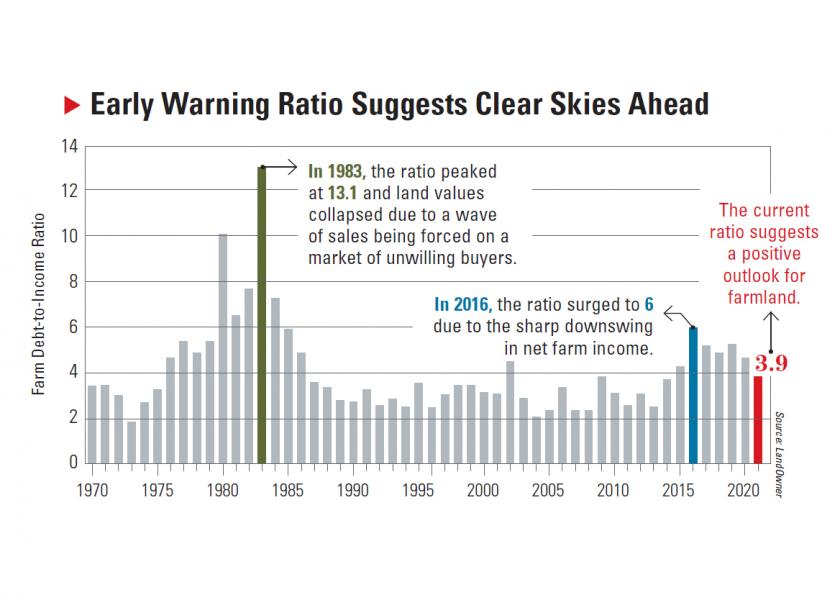
The ratio reflects how much total net farm income, as forecast by USDA, is available to service total farm debt. A high ratio, such as $6 of debt to $1 of net income, means debt is too high and income too low. If a high ratio exists for three years or longer, it signals farmland foreclosures and lower land prices are on the horizon.
For 2021, the ratio eased back under 4. That’s based on USDA’s recent forecast of $113 billion in net farm income.
“The ratio hovered under 6 the past five years, which reflects the improved financial health of the farm sector compared to the highly leverage farm economy that existed in the late 1970s, just ahead of the commodity prices collapse and resulting ag recession of the 1980s,” Walsten says.
For now, the metric shows farmers have lower leverage and are positioned to cope with several years of low commodity prices and paper-thin profit margins.
“This gives us confidence the farmland market is much more buffered from a washout collapse, such as in the 1980s,” Walsten says. “It does not mean the market is not vulnerable to 10% to 20% corrections. Such corrections are normal and healthy for a market. That next correction could occur as early as 2022, depending on when commodity prices ease and interest rates rise.”